

In this lesson we will introduce another type of support/resistance indicator—Fibonacci Retracements. The Fibonacci golden rule is based on certain mathematical relationships, expressed as ratios, between numbers in a series. Their discovery was popularized in the Western world by the thirteenth-century mathematician Leonardo Fibonacci. They have application in fields as diverse as biology, music, art, and architecture.In this lesson, we will focus on only the relevant Forex Fibonacci applications.
ADDITIONAL READING ABOUT FIBS BASICS
Fibonacci trading is becoming more and more popular because it works in any markets, including Forex and stock, which react easily to Fibonacci numbers and levels. Fibonacci trading involves knowing when and where the market reverses in order for it to keep moving.
The most important thing in Fibonacci trading is that the Fibonacci levels act as support and resistance. When the price goes up, they act as the resistance and vice versa. Also like ordinary supports and resistances, when a Fibonacci level is broken as a resistance, it can act as a support and can be retested. It works the same way when a Fibonacci support level becomes broken; it can then act as a resistance.
If you ask why Fibonacci Forex and Fibonacci stock markets work, the answer is “we don’t know”. The only thing we know is that Fibonacci numbers work in everything from microscopic materials like the DNA molecule to the distance between our eyes, ears, hands, even the distance of the planets in the solar system and the way they move in the space, even the distance and pathway of the stars in the universe and finally in the currencies’ prices and the way they move up and down. Fibonacci numbers can be found anywhere in the world.
INSTRUCTOR'S NOTES
All traders need to know about Fibonacci retracements is that there are certain percentages by which trends tend to retrace before continuing in their original direction. When a retrace begins, traders can mark these percentage levels, as a percentage of the trend's distance, and anticipate possible reversals at these levels, which can act as another form of S/R.
The key percentages are:
- 23.6%
- 38.2%
- 50.0%
- 61.8%
INTRODUCTION TO FIBS - TEXT VERSION
So far we’ve looked at two kinds of S/R:
- Price levels
- The most popular types of trend lines
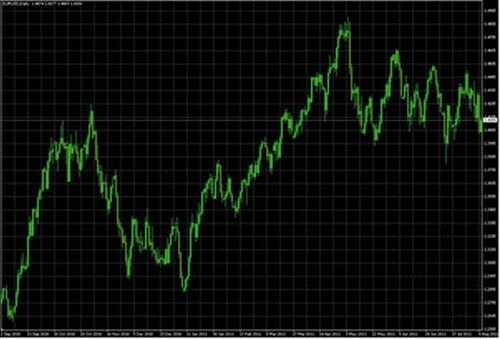
As in any financial market, forex prices don’t move straight up, down, or sideways. Instead, they zigzag within their overall longer term trends as markets test recent short term support and resistance.Let’s look at the chart below
In this lesson, we've talked about how and why the market prices of currencies move. The most important thing for you to remember is that only one thing moves the market: supply and demand from buyers and sellers. Traders profit by buying where there is demand, and selling where there is supply.
Fibs help us determine where prices are likely to either make these repeated short-term reversals as they zigzag within their longer term trend or make a longer-term reversal.
FIBONACCI TRADING
Fibonacci trading is trading is based on certain mathematical relationships, expressed as ratios, between numbers in a series. Their discovery has been attributed to (at least in the Western world) the thirteenth-century mathematician Leonardo Fibonacci. These relationships have application in fields as diverse as biology, music, art, architecture, and other fields. We’ll just focus on what’s relevant for Fibonacci Forex.
Traders found that trends tend to retrace prior moves according to these very same ratios, which in percentages translate to 23.6 percent, 38.2 percent, 50 percent, 61.8 percent, and 100 percent of a given trend.
For example, when a downtrend is finished, as it moves higher and ‘retraces’ the downtrend, it tends to pause or reverse after it has recovered 23.6%, 38.2%, 50%, 61.8% and 100% of the prior down trend.
By drawing lines that show the percent retracements of a prior trend on their charts, traders can better predict where future price moves might stall or reverse.
It’s unclear why trends tend to pause or reverse after recovering these percentages of the prior trend, but they do. So view fibs like electricity. It works, so use it even though you may not understand why it works. The proof that they work is that they’ve become another widely accepted and watched S/R indicator.
As with any technical indicator, now that fibs have become widely accepted and watched, they create a degree of self-fulfilling prophecy, and so become even more useful for anticipating price movements.
Here is an illustration of how Fibonacci works.
If you look at the chart below you will see an example of Fibonacci trading in action. It’s actually the same chart as we saw above, with Fib levels (horizontal lines) drawn in for the range of the downtrend of December 2009 to June 2010. Note how well the Fibs predict S/R as the EURUSD begins an uptrend that retraces the prior downtrend.
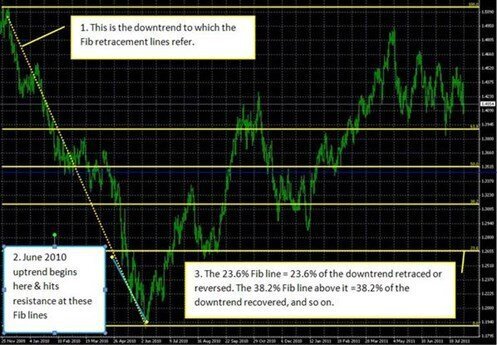
Source: MetaQuotes Software Corp, and The Sensible Guide To Forex: Safer, Smarter Ways to Survive and Prosper From The Start (Wiley & Sons, 2012)

03 Comments
“TM Academy is a great foundation for learning how to trade, do not think you take a class and then you're a trader. It takes practice and patience to be proficient.”
“I really appreciate the level of knowledge of our Forex Instructor. His qualifications for teaching the class are the highest i could imagine. I'm very excited about what we have learned here and looking forward to putting it into practice.”
Scot was extremely helpful in his teaching methods. ”