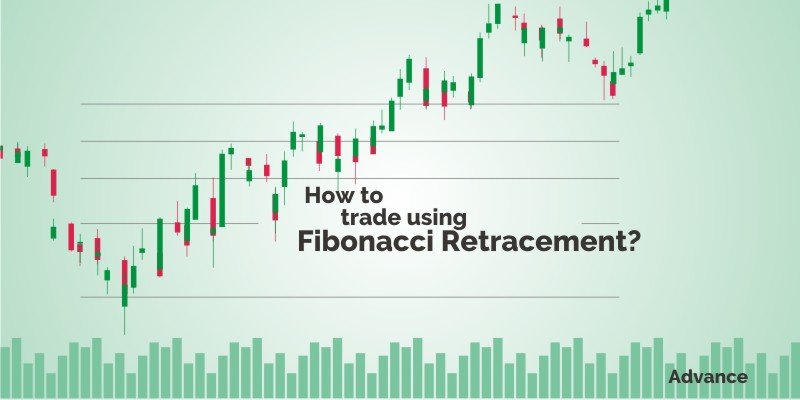

Using Fibonacci retracement indicators on a graph is an excellent way to show Fibonacci levels.Applying Fibonacci retracement is not difficult at all. In this lesson, we will show how to draw FIBS in easy steps.Utilizing Fibonacci Forex retracement ratios as a support/resistance indicator can be a simple, useful tool.