
This lesson on Fibonacci Retracement will illustrate how to find minor support/resistance points which a trader may not see in a higher time frame.The FX Academy recommends utilizing multiple time frame analysis in intervals of approximately 4X shorter and/or longer, for example 1 Day, 4 Hour and 1 Hour charts of the same pair or cross, together at the same time.
ADDITIONAL READING FIBS WITHIN FIBS
When analyzing a graph, you should not rely on the Fibonacci golden ratio only. Always keep your reference points consistent.
Always follow long-term trends. This will allow the trader to apply Fibonacci retracements in the correct direction of momentum and set themselves up for great opportunities.
Don’t use Fibonacci retracements over short intervals. Day trading the foreign exchange market has a lot of volatility. For this reason, applying Fibonacci retracements over a short time frame is ineffective. The shorter the time frame, the less reliable the retracements levels. Volatility can, and will, skew support and resistance levels, making it very difficult for the trader to really pick and choose what levels can be traded profitably.
FIBONACCI RETRACEMENT LEVELS
The goal of this exercise is to find S/R points you wouldn’t otherwise see in your main time frame. Once you’re aware of these shorter and longer term S/R points, you won’t be surprised if a trend pauses or reverses because of them. Thus you’ll be warned about trades that aren’t as promising as they looked in your main trading time frame.
As a rule of thumb, we want to see S/R on charts with time frames about 5 times shorter and longer than we normally use.
For example, if you trade from 60 minute candle charts, you’d choose 5 minute and 4-5 hour charts to see shorter and longer term S/R. If you trade from daily charts, you’d want to use 4-5 hour charts to see shorter term S/R points and use weekly charts to see stronger S/R points.
If this sounds confusing, look at a good illustration using Fibonacci retracements of how shorter term S/R points lurk within longer timeframes.
We’ll illustrate this point using fibs because unlike other kinds of S/R, you can see the shorter and longer term S/R areas all at once on one chart, by plotting sets of fibs for the shorter term up and down trends that occur within a longer trend.

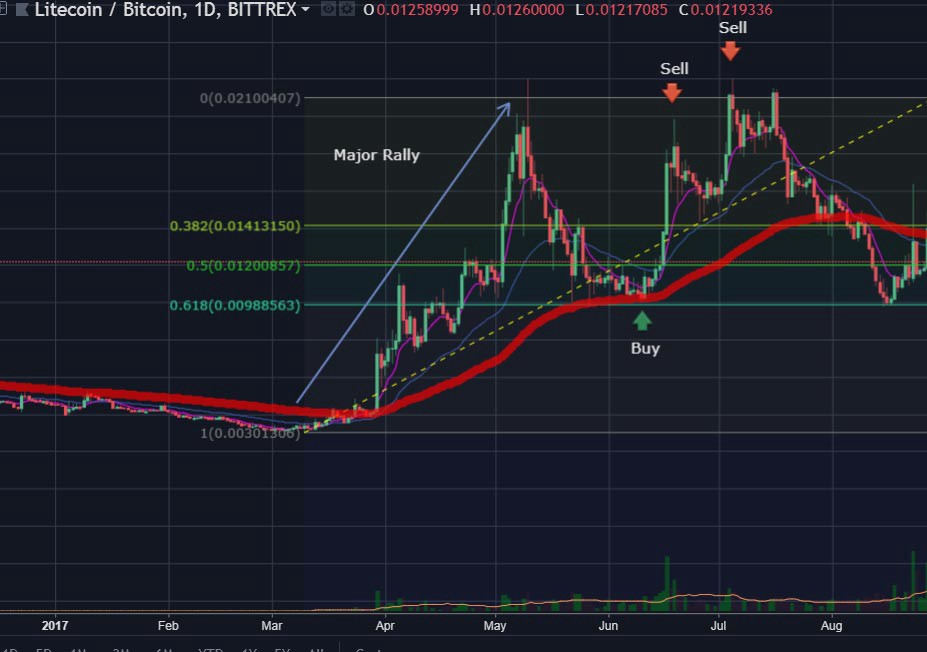
In this graph we have plotted 2 sets of Fibonacci retracement levels , one based on both the longer term downtrend on the left (long yellow fib lines) and on the shorter term uptrend on the right (shorter blue fib lines).
The key point here is that we plotted 2 sets of fibs, one (blue) based on the shorter term uptrend on the right and the other (yellow) based on the longer term downtrend on the left.
We should take note of how the second “nested’ set of blue fibs, based on that uptrend, show us possible S/R points we might not have otherwise anticipated for the latest move lower.
We should also take notice of how well those blue fibs indeed predicted where the latest move lower would pause or reverse.
Here’s another interesting bit of information regarding Fibonacci numbers:
There is a special ratio that is used to describe the foundation for an incredible mathematical relationship behind phi. This is the Fibonacci sequence (1, 1, 2, 3, 5, 8, 13, 21, 34, 55, 89, 144 . . .) and it occurs throughout the worlds of nature, art, music, and mathematics! It is called the ‘golden ratio’ and in the financial arena, it is referred to as the Fibonacci golden ratio.

03 Comments
“Traders Street is a great foundation for learning how to trade, do not think you take a class and then you're a trader. It takes practice and patience to be proficient.”
“I really appreciate the level of knowledge of our Forex Instructor. His qualifications for teaching the class are the highest i could imagine. I'm very excited about what we have learned here and looking forward to putting it into practice.”
Scot was extremely helpful in his teaching methods. ”