•  

    A 1006 Blue Bay Tower, Business Bay, Dubai

CANDLE ANATOMY AND MEANING

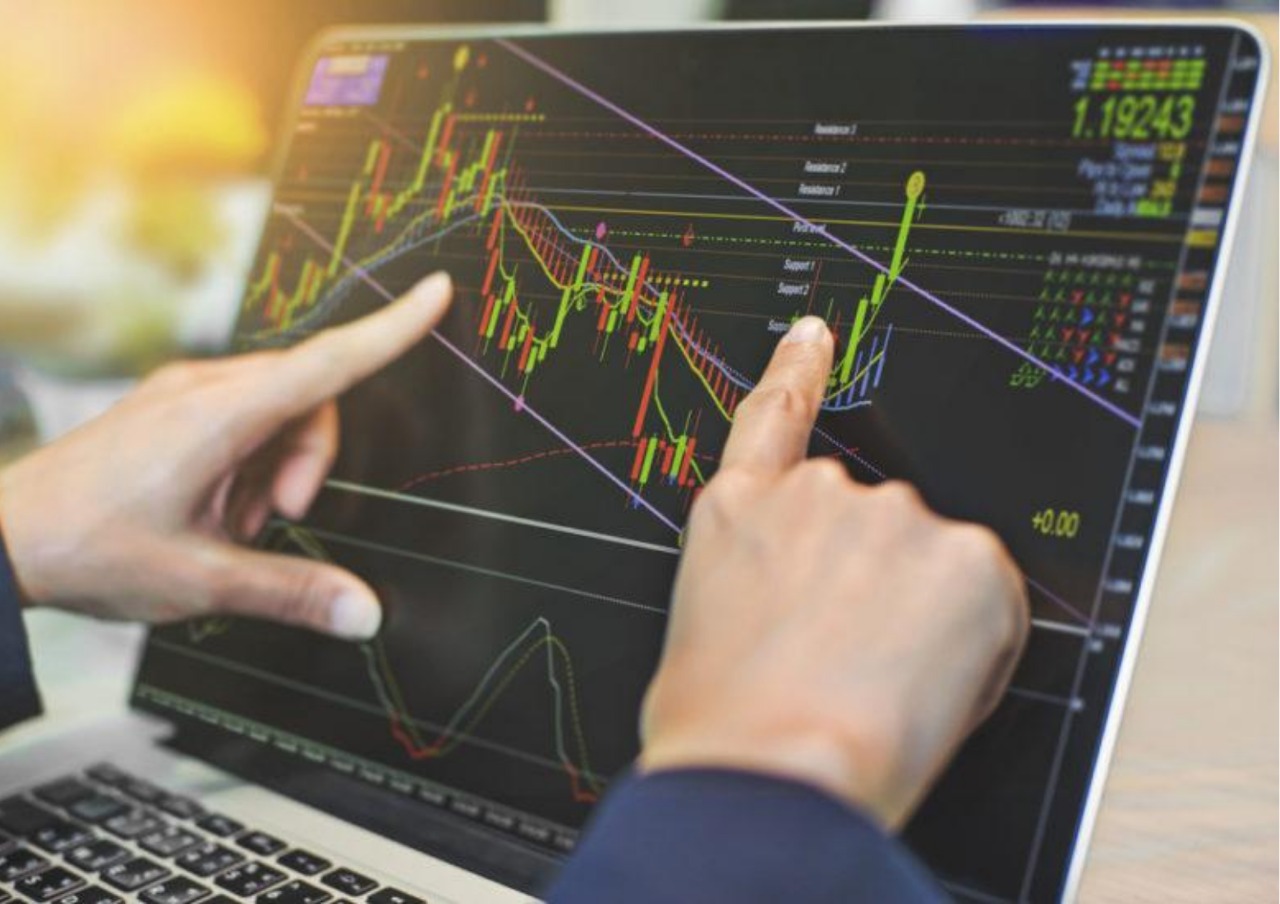
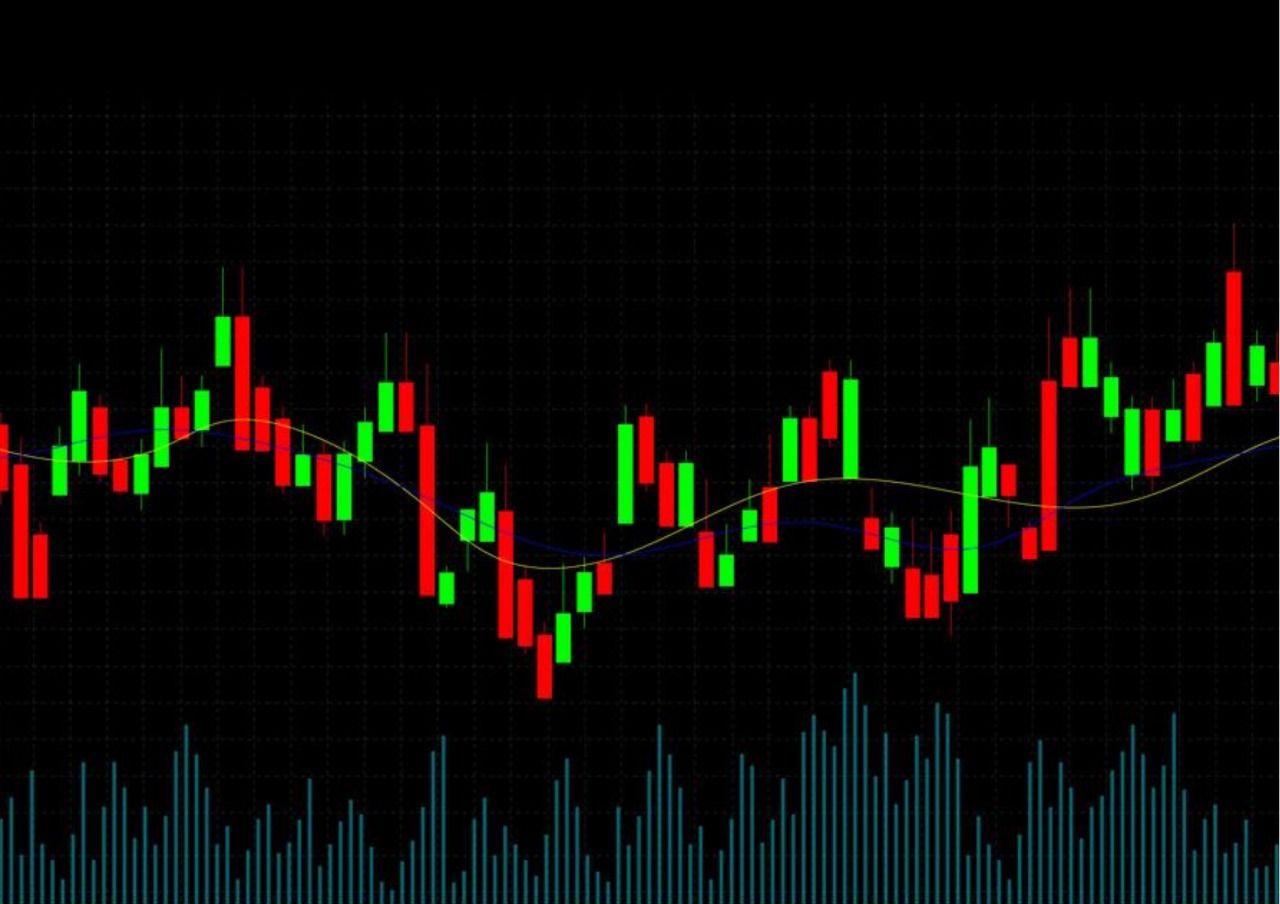
Being able to gauge the strength of a support/resistance level is a basic necessity for successfully predicting price movements. Candlestick Forex analysis can be a powerful tool if used correctly.This lesson shows how a trader can view certain support and resistance indicators or signals with an understanding of why the price is likely to move in a certain direction. Patterns on a candlestick chart will indicate specific price levels at which a currency pair should be sold or bought.

Understanding Price Movement

To gauge the strength of a given S/R level, and thus predict whether or not the price is likely to break through, it is important to look at how well the S/R level fulfills the IRATE criteria. IRATE stands for Indicators, Round Numbers, Age, and TEsted. Each of these factors contribute to the likely strength of the support/resistance level.

Price Movement Demonstartion

So far we talked about individual candlesticks. This lesson will explain how candlesticks representing smaller periods of time are components of larger time-frame candlesticks representing larger periods of time. Certain types of candlesticks that occur consecutively form candlestick patterns. The identification and use of some of these patterns - candlestick analysis - can be a basis for profitable trading. Candlestick analysis, otherwise known as price action analysis, is more important and usefully predictive than indicators based on price.

Step By Step Application

This lesson reviews what has been taught up to this point about candlestick analysis and support and resistance levels by taking you, step by step, through a real historical EUR/USD candlestick chart